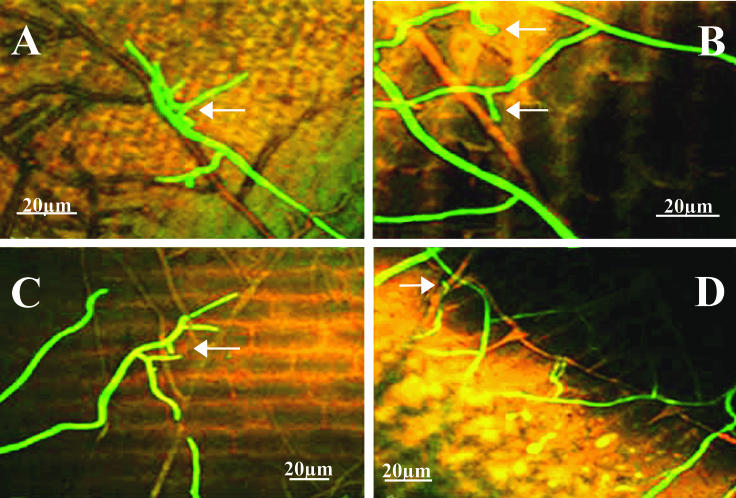
FIG. 3.
CSLM images of cucumber seed cryosections prepared 10 days (A), 12 days (B), 14 days (C), and 18 days (D) after planting in sterile soil inoculated with P. ultimum at a concentration of 3.1 × 10³ propagules g−1. The arrow in panel A indicates an aggregation of T. atroviride hyphae on P. ultimum hyphae. The arrows in panel B indicate papilla-like swelling of T. atroviride hyphal tips. The arrow in panel C indicates branching T. atroviride hyphae extending towards P. ultimum hyphae. The arrow in panel D indicates coiling of T. atroviride hyphae around P. ultimum hyphae. All images were taken with a ×20 objective.

