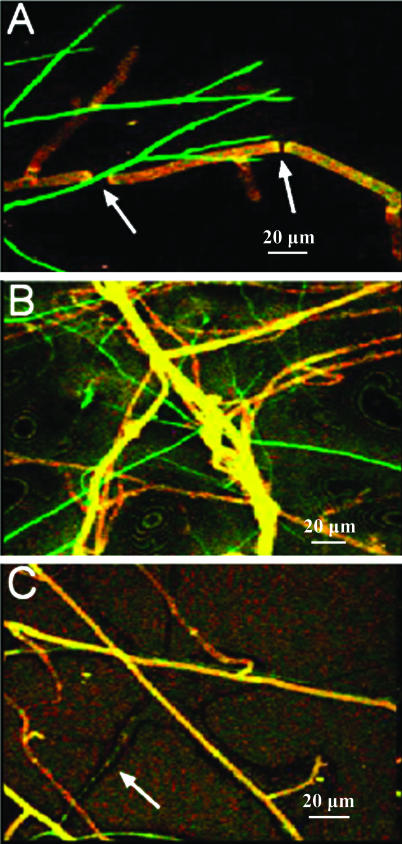
FIG. 4.
CSLM images of induction of chitinase genes in the T. atroviride nag1::gfp mutant (A) and the T. atroviride ech42::gfp mutant (B) by R. solani hyphae. In panels A and B the T. atroviride hyphae are green fluorescent due to contact with the R. solani hyphae, and the R. solani hyphae are reddish yellow. The arrows in panel A indicate breakage points in the R. solani hyphae. (C) Coculture of R. solani and wild-type T. atroviride (no gfp) (arrow) for comparison. All images were taken with a ×20 objective.

