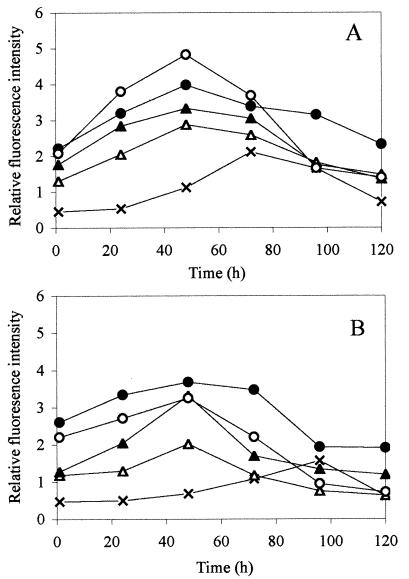
FIG. 5.
Relative fluorescence intensity, expressed per 0.1 mg (dry weight) of Trichoderma hyphae, upon chitinase gene induction of the T. atroviride nag1::gfp mutant (A) or the T. atroviride ech42::gfp mutant (B) in the presence of ground chitin at concentrations of 0.5 mg ml−1 (▵) and 2.5 mg ml−1 (○) or in the presence of R. solani hyphae at concentrations of 0.5 mg ml−1 (▴) and 2.5 mg ml−1 (•). Controls (×) consisted of T. atroviride mutant strains with no chitin or R. solani hyphae added. Each data point represents the mean of triplicate samples, which did not vary more than 10% from the mean.

