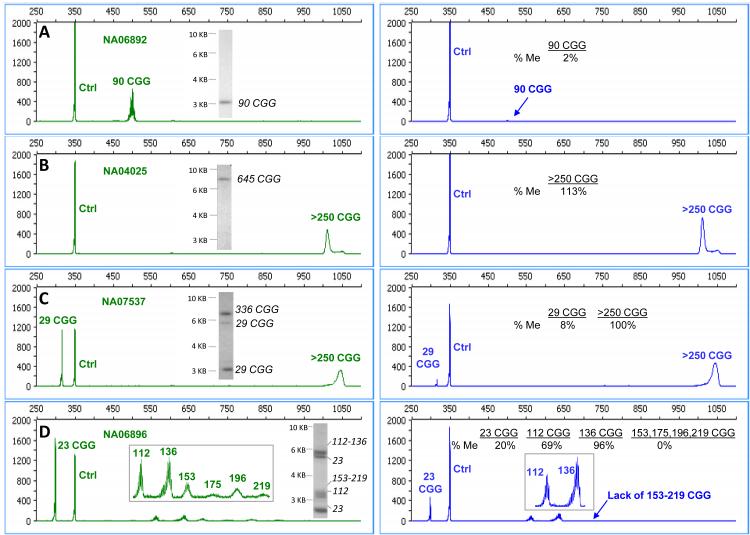
Figure 3. Assessments of cell line DNA samples by mPCR-CE and SB across a representative range of genotypes and methylation states.
Electropherograms for the control reaction in the HEX channel (left, both methylated and unmethylated templates) compared with electropherograms for the HpaII reaction in the FAM channel (right, methylated templates only). The corresponding SB images for each sample are shown as insets for A) NA06892, B) NA04025, C) NA07537 and D) NA06896. The specific CGG sizes corresponding to bands revealed by SB analysis were mapped from the corresponding mPCR-CE data.

