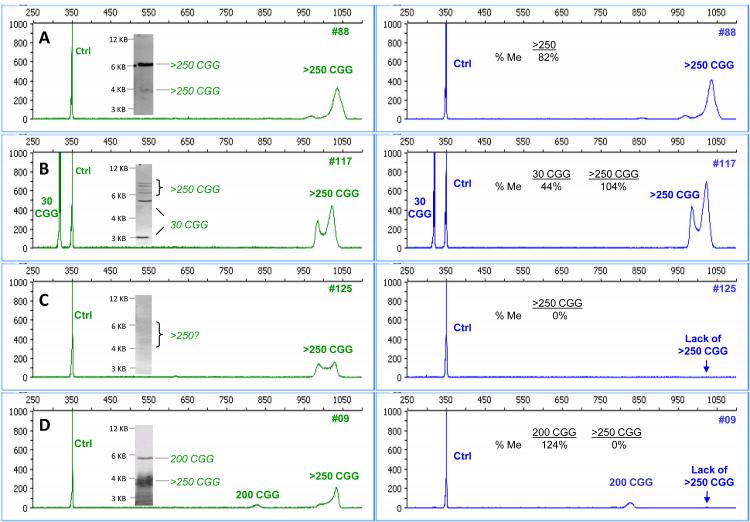
Figure 4. mPCR-CE resolves the full spectrum of methylation status in full mutation alleles with enhanced sensitivity compared to FMR1 SB.
Electropherograms for the control reaction in the HEX channel (left) are compared with electropherograms for the HpaII reaction in the FAM channel (right) for a series of full mutation samples. The corresponding SB images for each sample are shown as insets for samples A) #88, B) #117 C) #125 and D) #009.

