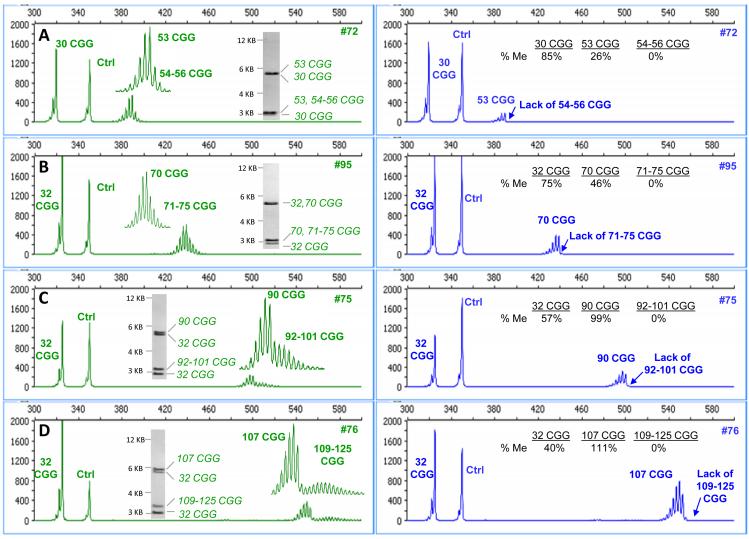
Figure 5. mPCR-CE identifies novel patterns of skewed methylation in female premutation alleles that are obscured using low resolution SB.
Electropherograms for the control reaction in the HEX channel (left) are compared with electropherograms for the HpaII reaction in the FAM channel (right) for a series of female premutation samples. In each case, differential and skewed methylation patterns were observed (plot insets). CGG repeat lengths were reported as the highest peak in the primary group of alleles and as a range of peaks exceeding 50 rfu for the secondary group. The corresponding SB images are included for samples A) #72, B) #95 C) #75 and D) #76.

