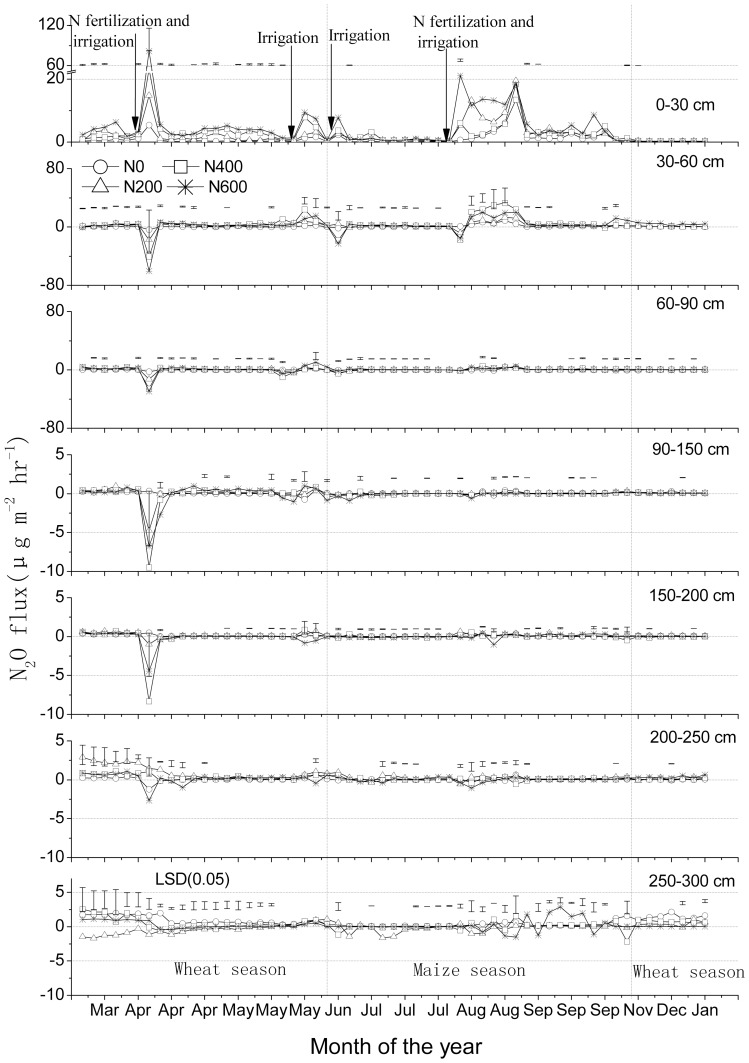
Figure 4. N2O flux rates (means ± standard deviations, n = 3) at various soil depths in a winter wheat-summer maize double cropping rotation receiving 0, 200, 400 and 600 kg of N ha−1 year−1, in 2007–2008.
Vertical dashed lines indicate a change in crop. Bars in figures indicate 1 standard deviation (n = 3). Note the differences in Y-axes.

