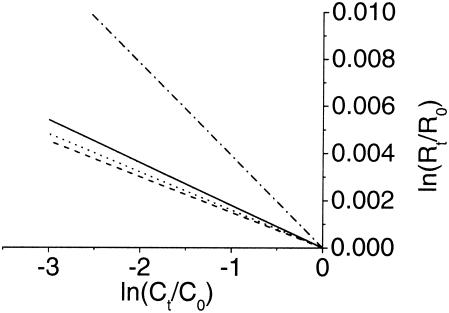
FIG. 3.
Stable carbon isotope fractionation during the degradation of m-xylene (—) and o-xylene (---) by strain OX39 and of m-cresol (·-·-) and p-cresol (···) by D. cetonicum. Regression lines of the 13C/12C isotope data over the respective concentrations are plotted according to equation 2, with r2 values of 0.968, 0.893, 0.942, and 0.946 for m-xylene, o-xylene, m-cresol, and p-cresol, respectively.

