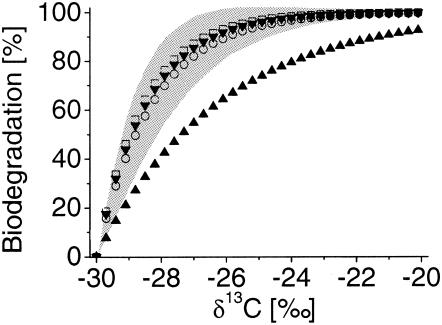
FIG. 4.
Calculation of the percentage of bacterial biodegradation based on the assumed amount of δ13C (per mille) isotope shifts. Curves with symbols are based on the isotope enrichment factors determined here for D. cetonicum degrading m-cresol (▴) and p-cresol (▾) and for strain OX39 degrading m-xylene (○) and o-xylene (□). The error range of biodegradation calculated for the average glycyl radical type enrichment factor is marked in grey.

