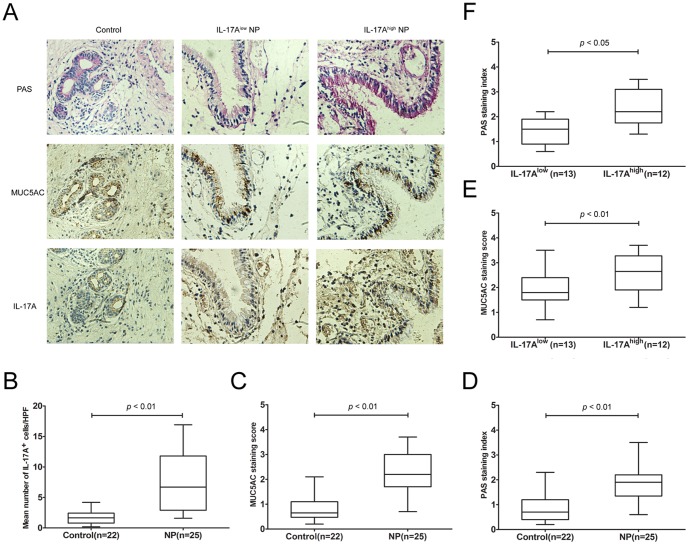
Figure 1. PAS staining and immunostaining of IL-17A and MUC5AC in polyp tissues and normal controls.
(A) Representative results of PAS staining and IHC staining of MUC5AC and IL-17A in polyp tissues and normal controls are shown (magnification, 200×). (B) The mean number of IL-17+ cells in polyp tissues and normal controls. (C) The PAS staining index in polyp tissues and normal controls. (D) The MUC5AC staining score in polyp tissues and normal controls. (E) The association between IL-17A and the PAS staining index in polyp tissues. (F) The association between IL-17A and MUC5AC staining scores in polyp tissues. Data are expressed as the medians (IQRs).

