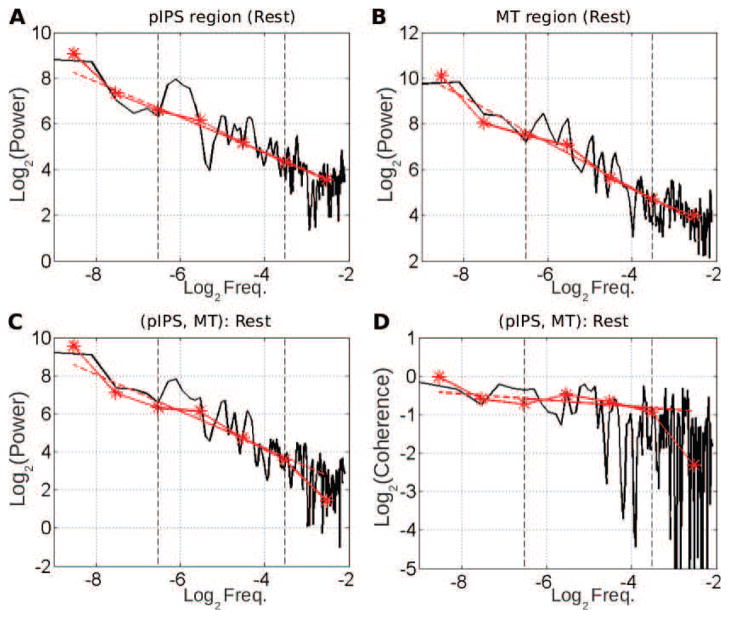
Figure 2. Univariate (A–B) and multivariate (C–D) scale-free properties of fMRI signals at rest – example from a single subject.
A–B: Superimposition of the auto-power spectrum estimated by Welch-Periodogram (black) and wavelet method (red) for pIPS and MT. C: Superimposition of the cross-power spectrum between pIPS and MT estimated by Welch (black) and wavelet method (red) in log-log coordinates. D: Superimposition of the coherence function between pIPS and MT estimated by Welch (black) and wavelet (red) method. All exponents are estimated from linear regression based on the wavelet estimate (dashed red lines) in the scaling range defined by vertical dashed black lines (−6.6< log2 f < −3.3).

