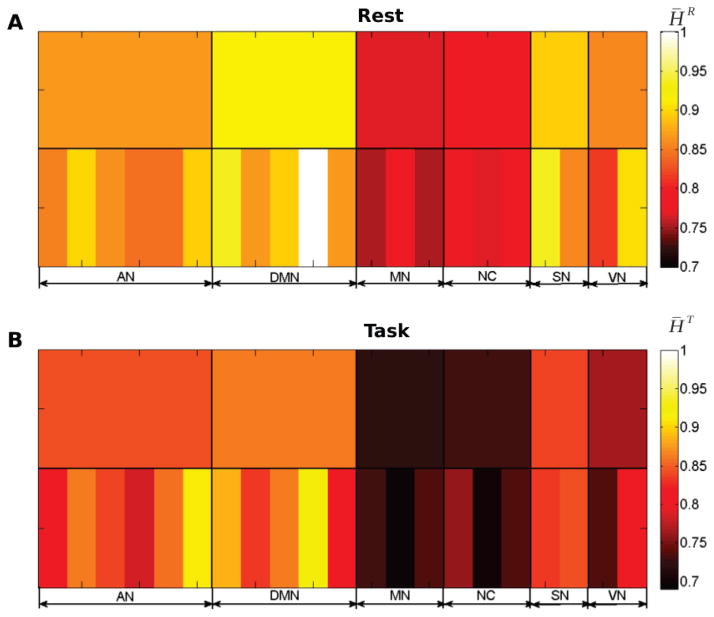
Figure 4. Hurst exponents from scale-free univariate analysis.
Group-averaged region-wise (bottom row) and network-average (top row) wavelet-based estimates of Hurst exponent at rest (A) and during task (B). The color scale is the same for A and B, to illustrate the decrease of Hurst exponents from rest to task.

