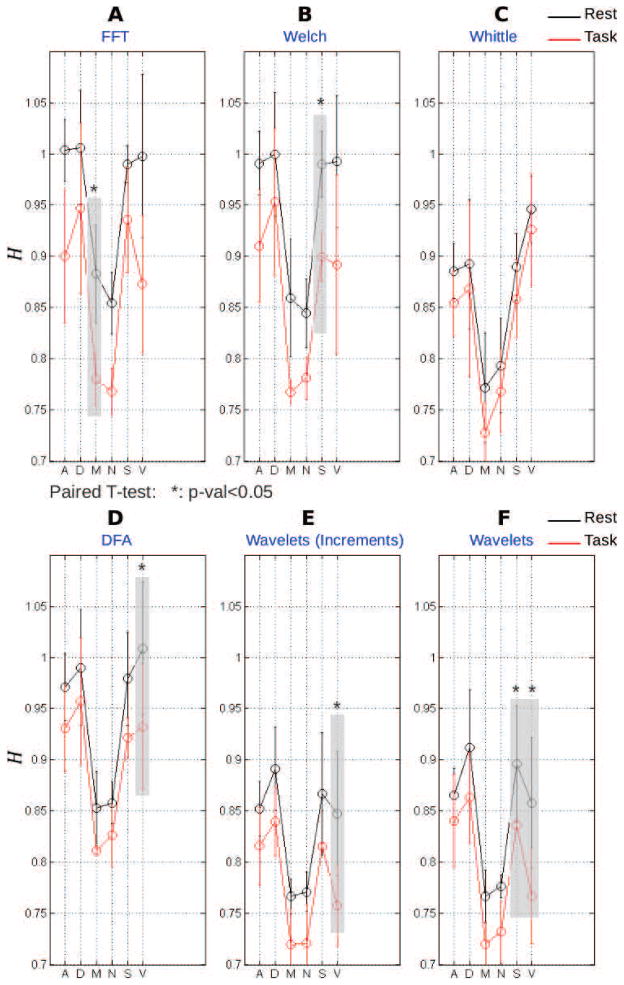
Figure 5. Group-level network-average Hurst exponent at rest (black) and during task (red) using six different estimation methods.
A: Standard periodogram (squared fast Fourier transform normalized by the number of samples) and subsequent linear regression on the log-log power spectrum plot. B: Welch-based (i.e., averaged across overlapping windows) periodogram followed by linear regression on the log-log power spectrum plot. C: Whittle estimator, which consisted of a maximum likelihood estimator of power spectrum under fractional Gaussian noise model. D: Detrended Fluctuation Analysis (DFA). E: Time-domain increment-based Hurst exponent estimate. F: Wavelet spectrum estimate, where the Hurst exponent was estimated from a linear regression in the log-log plot where the log along the x-axis involves scales instead of frequencies. X-axis labels indicate networks: A, Attention; D, Default-mode; M, Motor; N, Non-neocortical; S, Saliency; V, Visual. The shaded areas outline the significant differences of Hurst exponents between rest and task. Significant differences are indicated by *-marks (p-val<0.05, Bonferroni corrected).

