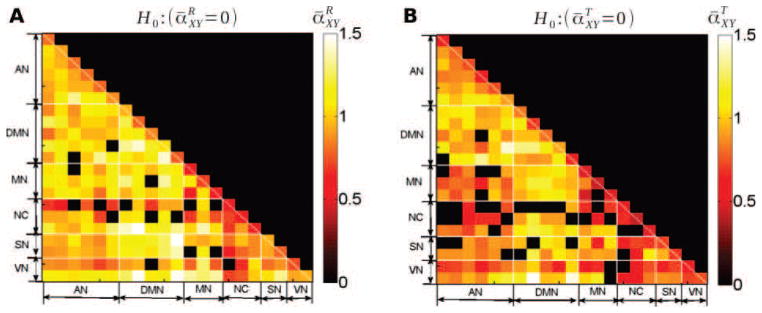
Figure 6. Cross-spectrum scaling exponents.

Group-average values of the scaling exponent of the cross-spectrum at rest (A) and during task (B), i.e. and , respectively. Only region pairs where the scaling exponent significantly departed from 0 (p < 0.05, Bonferroni corrected, one-sample t-test) are shown. Thus, scaling is significant for all cross-spectra associated with “hot squares”.
