
Figure 7. Cross-coherence scaling exponents.
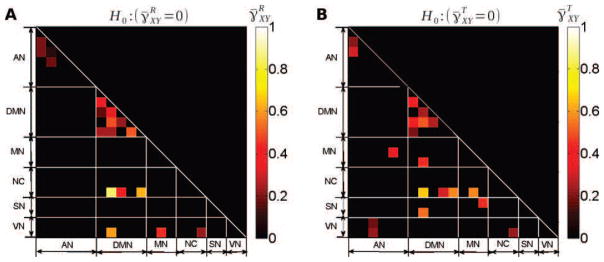
Group-average values of the scaling exponent of the cross-coherence function at rest (A) and during task (B), i.e. and , respectively. Only region pairs where the scaling exponent significantly departed from 0 (p < 0.05, Bonferroni corrected, one-sample t-test) are shown. So, scale invariance on the cross-temporal dynamics has a more complex structure than just averaging those coming from the ROI-based univariate time series in all “hot squares”.