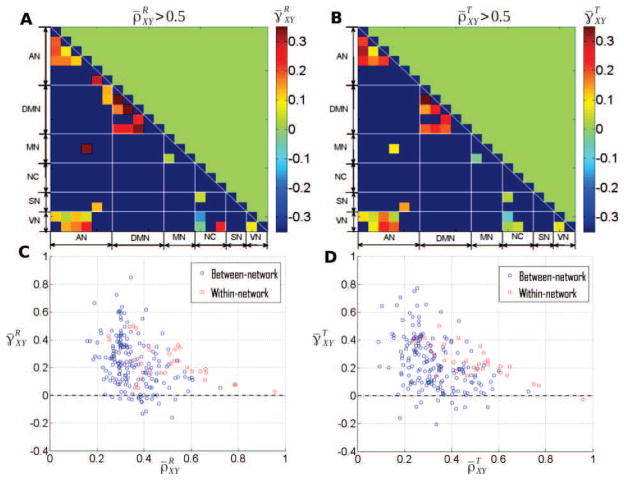
Figure 8. Relationship between the cross-coherence scaling exponent and the linear Pearson correlation.
A–B: For region pairs with a relatively large Pearson correlation (ρXY > 0.5), the scaling exponent of the cross-coherence function is plotted as color, for rest (A) and task (B), respectively. C–D: Cross-coherence scaling exponent plotted against the linear correlation coefficient for all region-pairs at rest (C) and during task (D). Within- and between-network region pairs are shown in red and blue, respectively.

