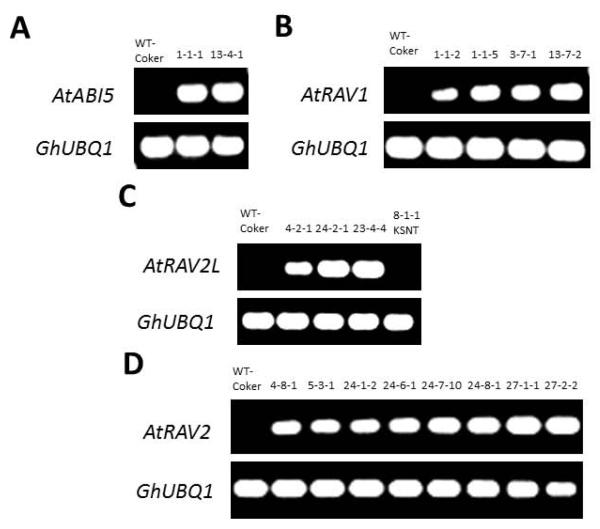
Figure 2.
Transcript expression analysis for transgenes in cotton lines by Reverse Transcriptase-PCR. GhUBQ1 was used as an internal control. (A) AtABI5 overexpression in two independent lines compared to wild type. (B) AtRAV1 overexpression in four independent lines compared to wild type. (C) AtRAV2L overexpression in three independent lines compared to wild type. (D) AtRAV2 overexpression in eight independent lines compared to wild type.

