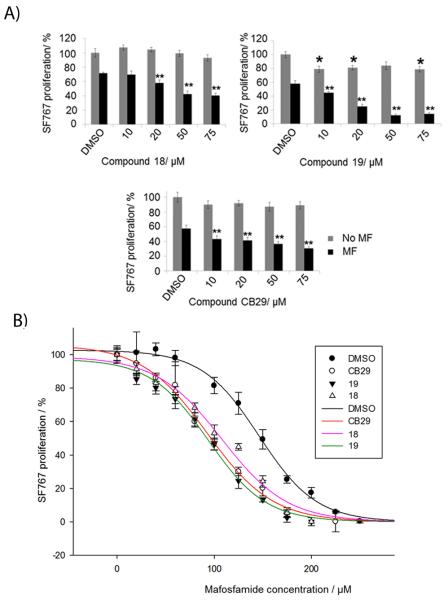
Figure 5.
Inhibition of ALDH3A1 with CB29 or analogs 18, 19 enhances mafosfamide cytotoxicity in a dose-dependent manner. (A) SF767 cells were treated with increasing concentrations of 18, 19, or CB29 and either in the presence or absence of 125 μM mafosfamide (n= 10-15). P values were calculated by comparing the cellular proliferation of DMSO treated cells versus ALDH3A1 inhibitor treated cells (*, p<0.05, n = 15) or mafosfamide (MF) treated cells versus (MF + ALDH3A1 Inhibitor) treated cells (**, p<0.005, n = 15). Grey bars represent ALDH3A1 inhibitor treatment alone and black bars represent ALDH3A1 inhibitor in combination with mafosfamide treatment. Each bar represents the mean value ± SE. (B) SF767 cells (10,000 cells/well) were treated with CB29, 18 or 19 (50 μM) with increasing concentrations of mafosfamide (0 μM - 250 μM). Cell proliferation was determined using MTT assay and plot for percent (%) proliferation was created using the SigmaPlot (v11, StatSys). Shaded circles (●) show SF767 cell proliferation treated with mafosfamide in the absence of inhibitors. Open circles (o), inverted shaded triangles (▼) and open triangles (△) show cell proliferation with mafosfamide in the presence of inhibitors CB29, 19, and 18 respectively. The solid trend lines [MF + DMSO (black), MF + CB29 (red), MF + 19 (pink), MF + 18 (green)] represent the fits to the 3-parameter logistics equation. DMSO concentration was limited to 0.25% (v/v) (n = 15). Figures were generated using SigmaPlot, v 11.0.

