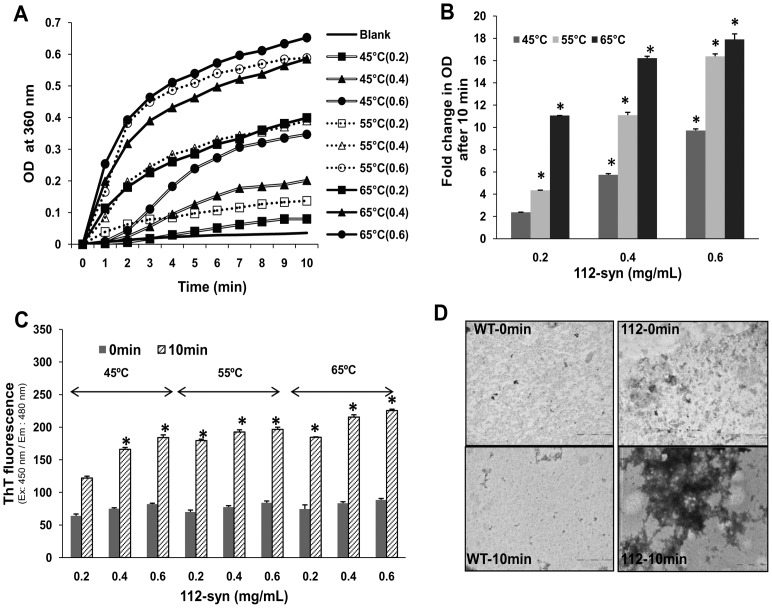
Figure 2. Temperature dependent aggregation of 112-syn.
(A) 112-syn at different concentrations (0.2, 0.4, 0.6 mg/mL in PBS) was heated at 45°C, 55°C, and 65°C and the light scattering was monitored at 360 nm for a period of 10 min as described under “Methods” section. (B) Fold change in the net absorbance values from (A) at 360 nm before and after heating the reaction mixtures. (C) ThT fluorescence of reaction mixtures as indicated in (A) before (0 min) and after exposing the samples at indicated temperatures for 10 min.*p<0.01 as compared to 0 min readings for both (B) and (C). (D) Negatively stained TEM images of WT and 112-syn before and after exposure to 65°C for 10 min.

