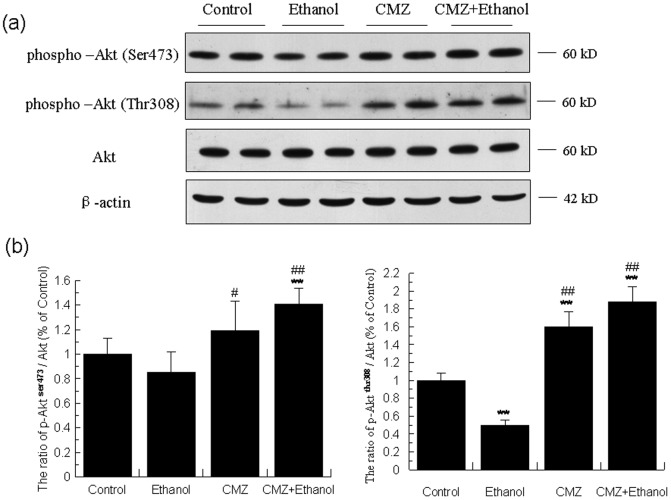
Figure 7. CMZ co-treatment led to the increased phosphoryaliton and activation of Akt.
Total protein samples were prepared using RIPA buffer, and protein levels of phospho-Aktser473, phospho-Aktthr308, and the total Akt were detected by western blot. (a) Representative western blot band; (b) Quantitative data analyses. Data were presented as mean ± SD from at least 3 independent experiments, and expressed as the percentage of the control. **P<0.01, compared with control group; # P<0.05, ## P<0.01, compared with ethanol group.

