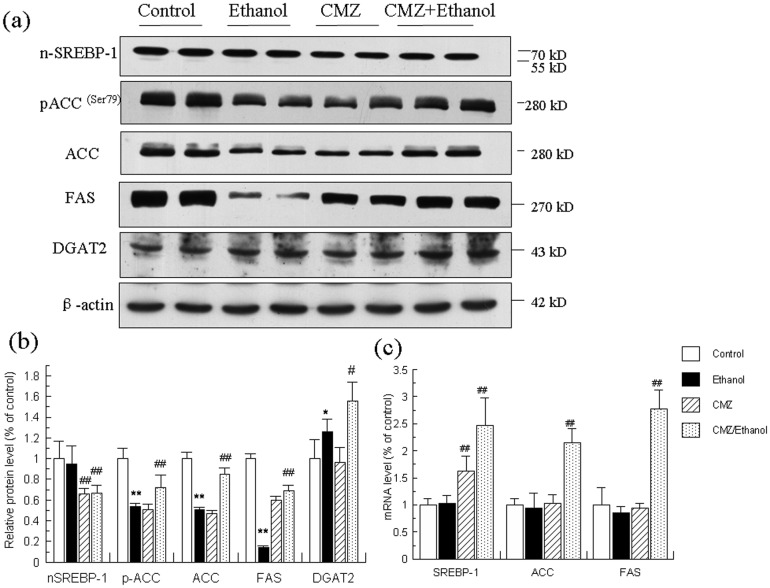
Figure 9. Effects of ethanol and CMZ on the mRNA and protein levels of n-SREBP-1, phospho-ACCser79, ACC, FAS, and DGAT2.
(a) Representative western blot bands for n-SREBP-1, phospho-ACCser79, ACC, FAS, and DGAT2. (b) Quantitative data analyses. (c) The mRNA levels of SREBP-1, ACC, and FAS. Data were presented as mean ± SD from at least 3 independent experiments, and expressed as the percentage of the control. *P<0.05, **P<0.01, compared with control group; # P<0.05, ## P<0.01, compared with ethanol group.

