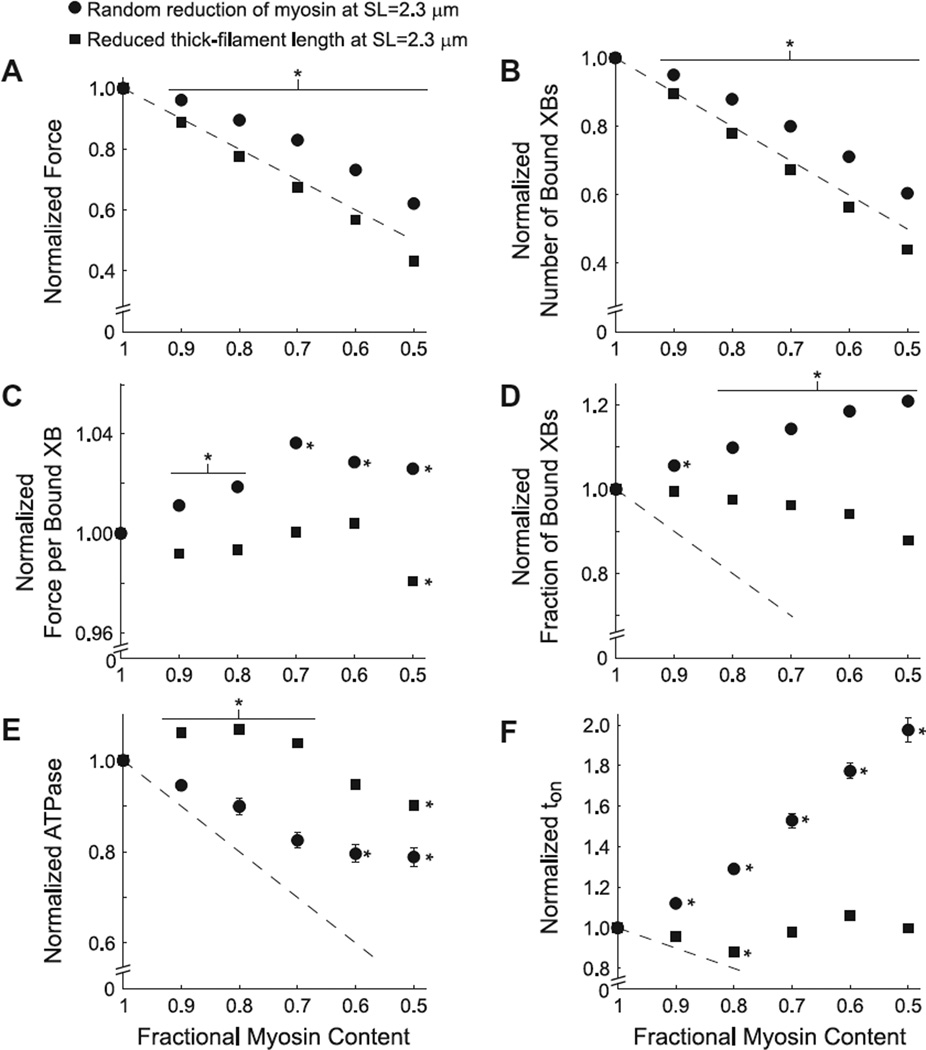
Figure 3. Random vs. uniform reductions in myosin content at a sarcomere length of 2.3 µm.
Normalized steady-state values of A) force, B) cross-bridge (XB) binding, C) force per bound XB, D) fractional XB binding, and E) ATPase, and F) ton are plotted against myosin content. Myosin content was reduced two ways: randomly along thick filaments and uniformily from the Z-line end of thick-filaments. Data represent simulations at pCa=4.0 and kxb=3 pN nm−1normalized to values at 100% myosin content. * denotes differences from 100% myosin content (mean±SE).

