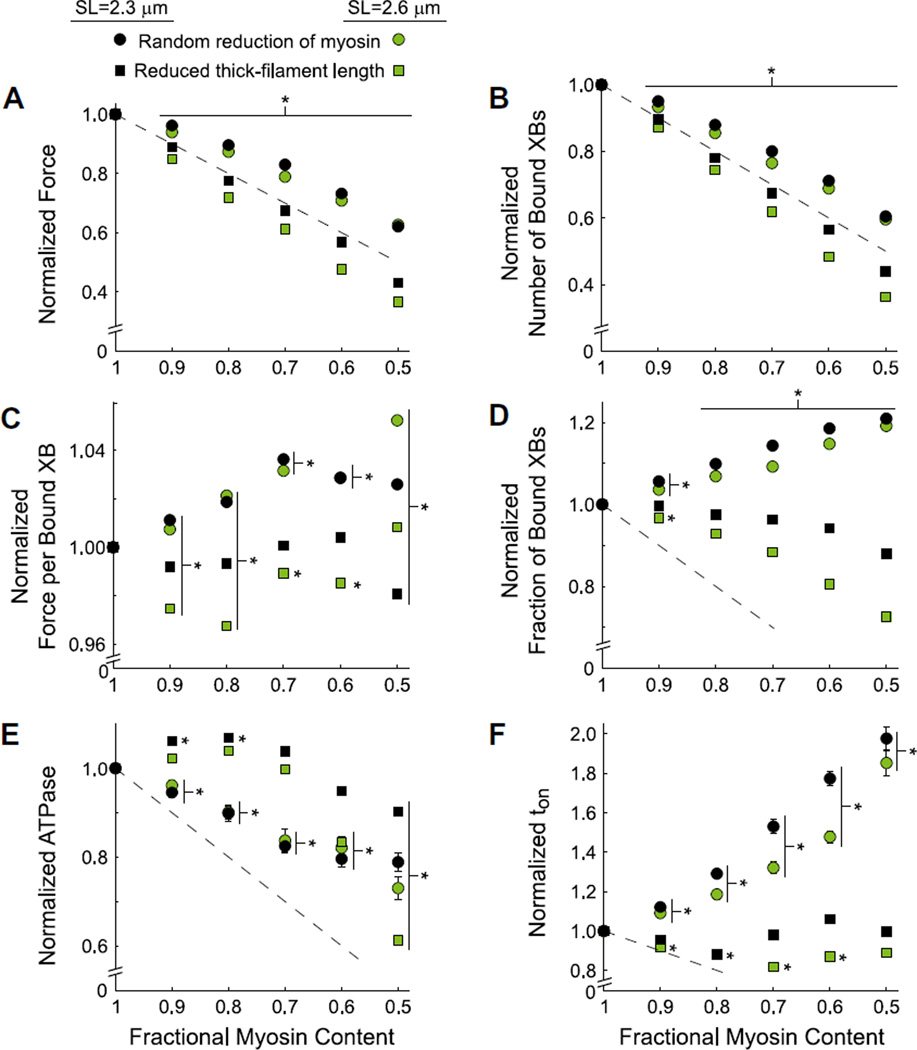
Figure 5. Random vs. uniform reductions in myosin content at 2.3 and 2.6 µm SL.
Normalized steady-state values of A) force, B) cross-bridge (XB) binding, C) force per bound XB, D) fractional XB binding, and E) ATPase, and F) ton are plotted against myosin content, as myosin was decreased randomly or uniformly from thick-filaments. Data represent simulations at pCa=4.0 and kxb=3 pN nm−1 at SL values of 2.3 or 2.6 µm. Data were normalized to values at 100% myosin content for each SL. * denotes differences from 100% myosin content (mean±SE).

