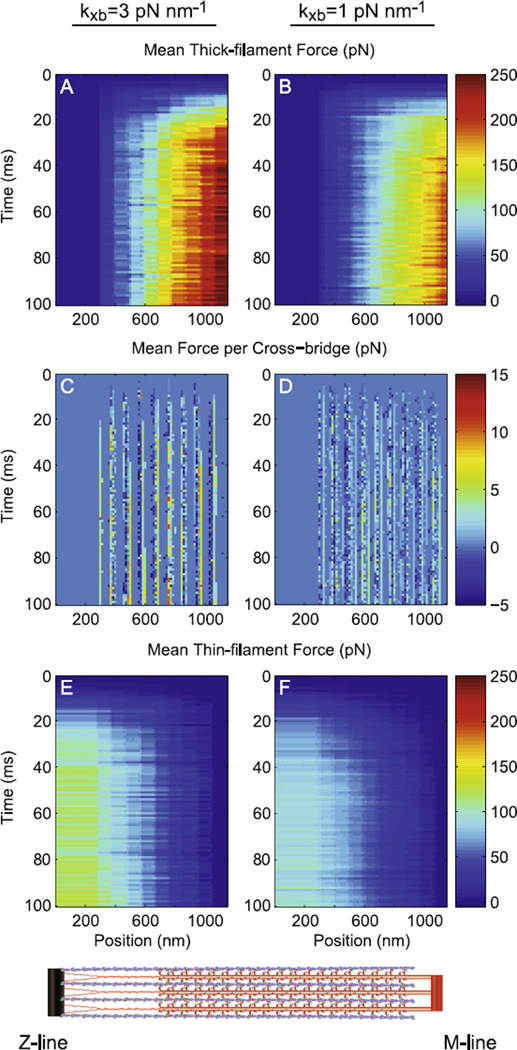
Figure 6. Force distribution throughout the half-sarcomere as kxb varied.
Average force borne by A–B) thick-filaments, C–D) cross-bridges, and E–F) thin-filaments is shown for simulations with kxb values of 3 (panels A, C, E) and 1 (panels B, D, F) pN nm−1 (pCa=4.0 and SL=2.3 µm at 100% myosin content). Note that thick- and thin-filament color bars ranges 0–250 pN, while cross-bridge color bar ranges from −5–15 pN.

