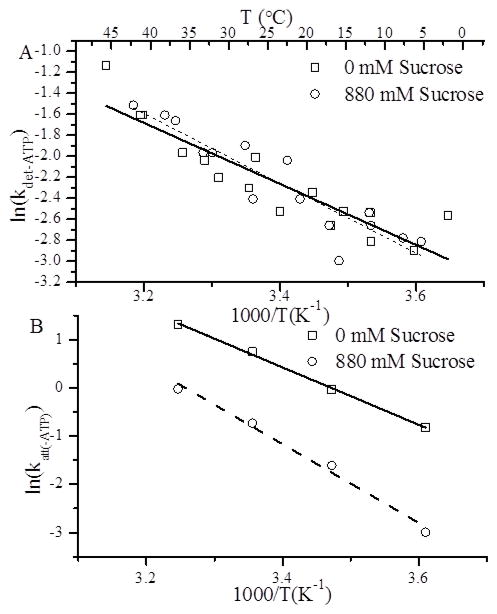
Fig. 10.
The effects of temperature on (A) kdet(−ATP) and (B) katt(−ATP). (A) Fluorescence transients were obtained following rapid mixing of 0.5 μM S1 + 0.5 μM pyrene actin with 25 μM unlabeled actin both in the presence (○) and absence (□) of 880 mM sucrose. Approximately 4–7 transients were fitted to single exponentials to obtain values for kdet(−ATP). These experiments were repeated at different temperatures and ln(kdet(−ATP)) values were plotted versus inverse temperature in an Arrhenius plot. The slope of linear fits to these plots gave values for the activation energy, Ea, and showed that sucrose had no significant effect on Ea (see Table I). (B) Fluorescence transients (~4–7) following rapid mixing of 0.25 μM S1 with different concentrations of pyrene actin were fitted to single exponentials to obtain keff· katt(−ATP) was obtained from the slope of the [A]-dependence of keff as previously described (Fig. 7 B). These experiments were repeated at different temperatures, and the temperature-dependence of katt(−ATP) was plotted in Arrhenius plots (see above), showing that sucrose increases Ea for A-M strong binding (see Table I).

