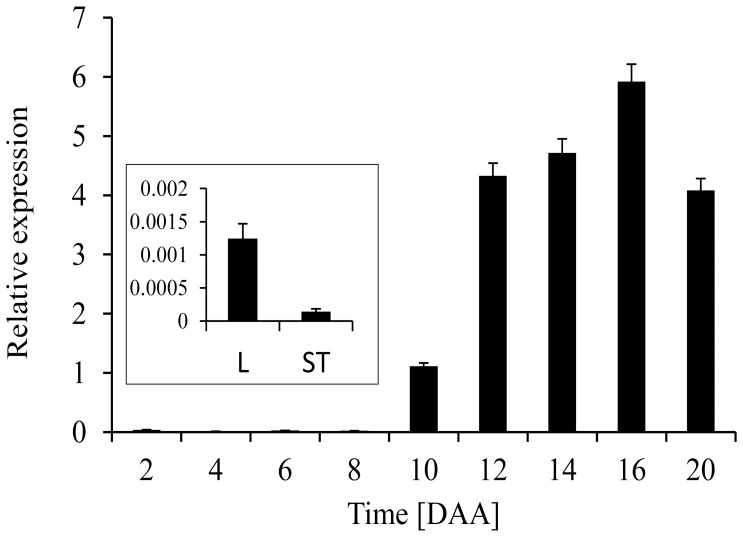
Figure 3. Real-time qPCR analysis of HvBT1 in different tissues.
Quantitative real-time RT-PCR was used to determine the expression level of HvBT1 in different tissues using gene specific primers. β-actin, a housekeeping gene from barley, was used as a reference gene Seed samples during grain filling (2 to 20 DAA) and autotrophic tissue samples (stem and leaf) were used for gene expression analysis (see inset).

