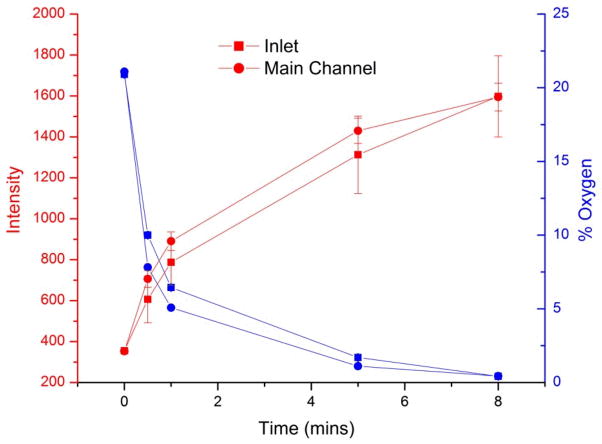
Figure 2.
Oxygen concentrations in hypoxia chips with constant introduction of medium. The concentration of oxygen was measured at two points in the chip, the inlet and the main channel (located at the first culture unit). The increase in fluorescence intensity of the ruthenium dye corresponds to the decrease in oxygen concentration. After 5 minutes, the oxygen concentration at both points was 1%. Errors represent 1 standard deviation of the mean signal (oxygen concentration error bars are too small to be seen). The deoxygenated PDMS served as an oxygen sink, so that oxygen entering the chip (via infused medium) was removed before reaching the culture inlets.

