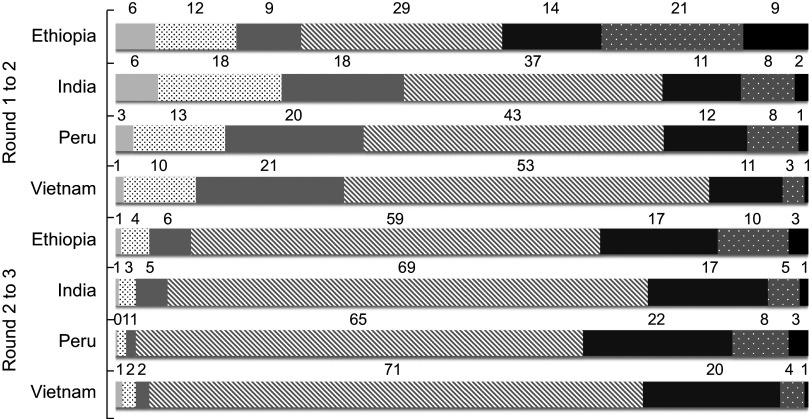
Fig 2.
Categories of change in height-for-age Z-score (HAZ) between rounds ( , decrease in HAZ of ≥2·00;
  , decrease in HAZ of 1·00–1·99;
  , decrease in HAZ of 0·50–0·99;
  , change in HAZ within –0·49 to +0·49;
  , increase in HAZ of 0·50–0·99;
  , increase in HAZ of 1·00–1·99;
  , increase in HAZ of ≥2·00), by country, among children (n 7171) in four low- and middle-income countries; the Young Lives study. Bars represent the percentages of children in each category of HAZ change

