
Figure 1.
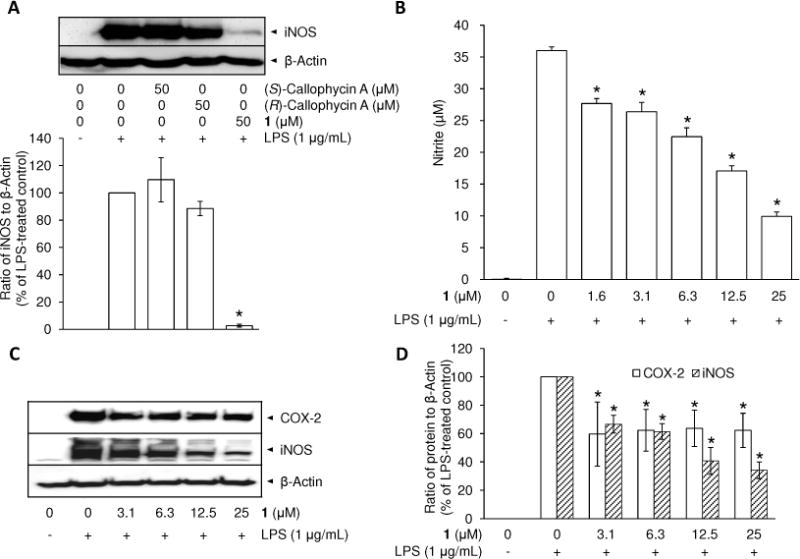
Comparison of the effect of (S)- and (R)-callophycin A, and 1 on iNOS protein expression (A), inhibitory effect of 1 on nitrite production (B), and protein expression of COX-2 and iNOS (C, D) in LPS-stimulated RAW 264.7 cells. RAW 264.7 cells were pretreated with callophycin As or 1 for 15 min and stimulated with 1 μg/mL LPS for an additional 20 h. Protein expression levels of iNOS were examined by Western blot analyses (A). RAW 264.7 cells were pretreated with 1 (3.1–25 μM) for 15 min, and stimulated with 1 μg/mL LPS for 24 h. The level of nitrite was estimated using Griess reagent (B). The protein expression levels of COX-2 and iNOS were examined by Western blot analyses (C). After normalization to an internal standard β-actin, % expression relative to LPS-treated control (100%) is presented as means (n = 3) ± SD (D). An asterisk (*) indicates a significant difference between LPS-treated control and 1-pretreated/LPS-treated control with p values less than 0.05.