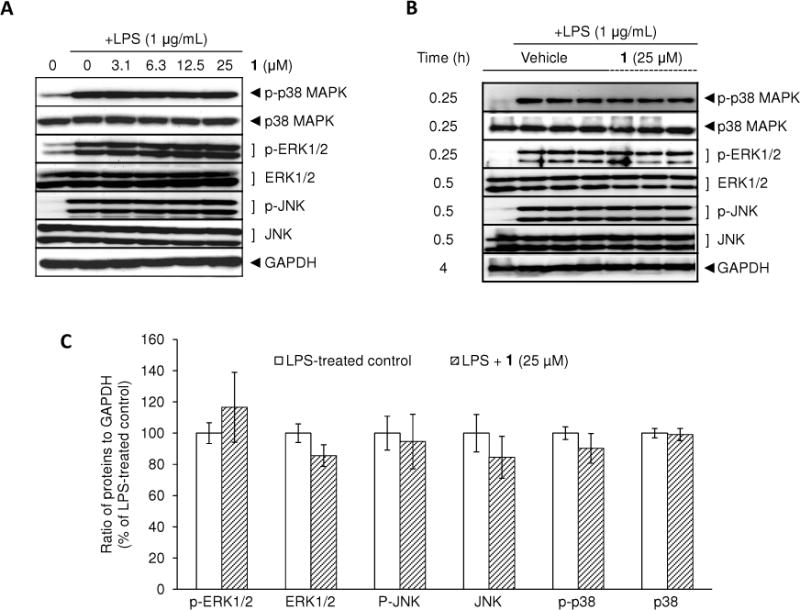
Figure 3.

Effect of 1 on LPS-induced MAPKs phosphorylation in RAW 264.7 cells. RAW 264.7 cells were treated with various concentrations of 1 for 15 min prior to LPS (1 μg/mL) treatment for 30 min. The protein expression levels of MAPKs were determined using Western blot analyses (A). After normalization to the internal standard GAPDH, % expression of the 1 (25 μM) pretreatment group relative to LPS-treated control in each MAPK (100%) is presented (n = 3) (B, C).
