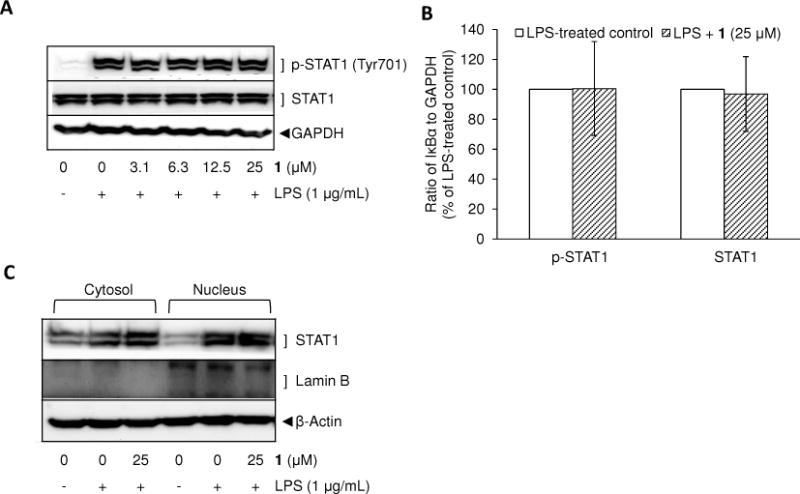
Figure 5.

Effect of 1 on LPS-induced phosphorylation (A, B) and nuclear translocation of STAT1 (C). RAW 264.7 cells were treated with various concentrations of 1 for 15 min prior to LPS (1 μg/mL) treatment for 4 min (A). The experiments were repeated with the highest concentration of 1 (25 μM) (B). Also, after 6 h of incubation with LPS, the nuclear and cytosolic proteins were extracted to determine nuclear translocation of STAT1. The protein expression levels were determined by Western blot analysis. After normalization to the internal standard GAPDH, % expression of the 1 (25 μM) pretreatment group relative to p-STAT1 and STAT1 expression in LPS-treated control (100%) is presented (n = 3) (B).
