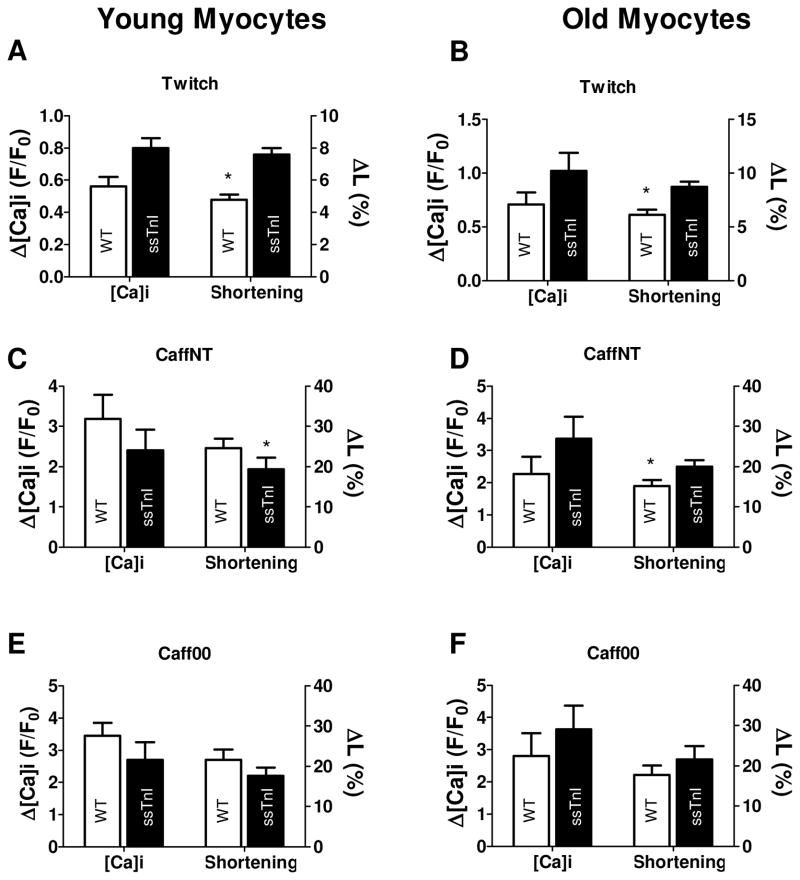
Fig. 2. Ca2+-transients obtained in young and older adult TG-ssTnI and NTG myocytes.
Panels A-C illustrate twitch, CaffNT and Caff00 contracture amplitudes for younger myocytes. Panels D-F show the corresponding relaxation times (tau,τ) for younger myocytes. TG-ssTnI myocytes show bigger (although not significantly different) twitch amplitude (twitch F/F0= 0.80±.0.06 vs 0.56±0.06 NTG). SR Ca2+ content (inferred by the amplitude of caffeine contractures) in young TG-ssTnI cells was not significantly different compared to young NTG myocytes (CaffNT F/F0= 2.40±0.52 vs 3.18±0.60, Caff00 F/F0= 2.70±0.55 vs 3.45±0.40. TG-ssTnI and NTG, respectively). Kinetics of twitch relaxation, as previously shown by Fentzke et al. (19) is relatively slow in TG-ssTnI (twitch τ= 367±39 vs 301±21 ms in NTG, but not significantly different. Both caffeine contractures are significantly faster in young TG-ssTnI (CaffNT τ=2.18±0.23 vs 4.3±0.33 s, p<0.05, Caff00 τ=11.94±1.9 vs 18.0±1.6 s, p<0.05 TG-ssTnI and NTG, respectively). During a twitch, Ca2+ transient amplitude follow the same tendency observed in the younger group, e.g. bigger amplitude but not significantly different between TG-ssTnI and NTG (F/F0= 1.02±0.17.TG-ssTnI vs 0.71±0.11 NTG). Caffeine-induced increased fluorescence levels for the TG-ssTnI group (CaffNT F/F0= 3.37±0.68 vs 2.27±0.53, Caff00 F/F0= 3.63±0.73 vs 2.80±0.72 were not significantly different from NTG (G–I). Relaxation kinetics (J–L) exhibit a slower recovery statistically significant for both caffeine contractures (twitch τ= 390±26 vs 362±32 ms, p> 0.05, CaffNT τ= 4.99±0.54 vs 2.95±0.33 s, p<0.05, Caff00 τ= 17.12±1.5 vs 12.01±1.3 s, p<0.05, TG-ssTnI and NTG, respectively). * indicates p<0.05 between TG and WT.

