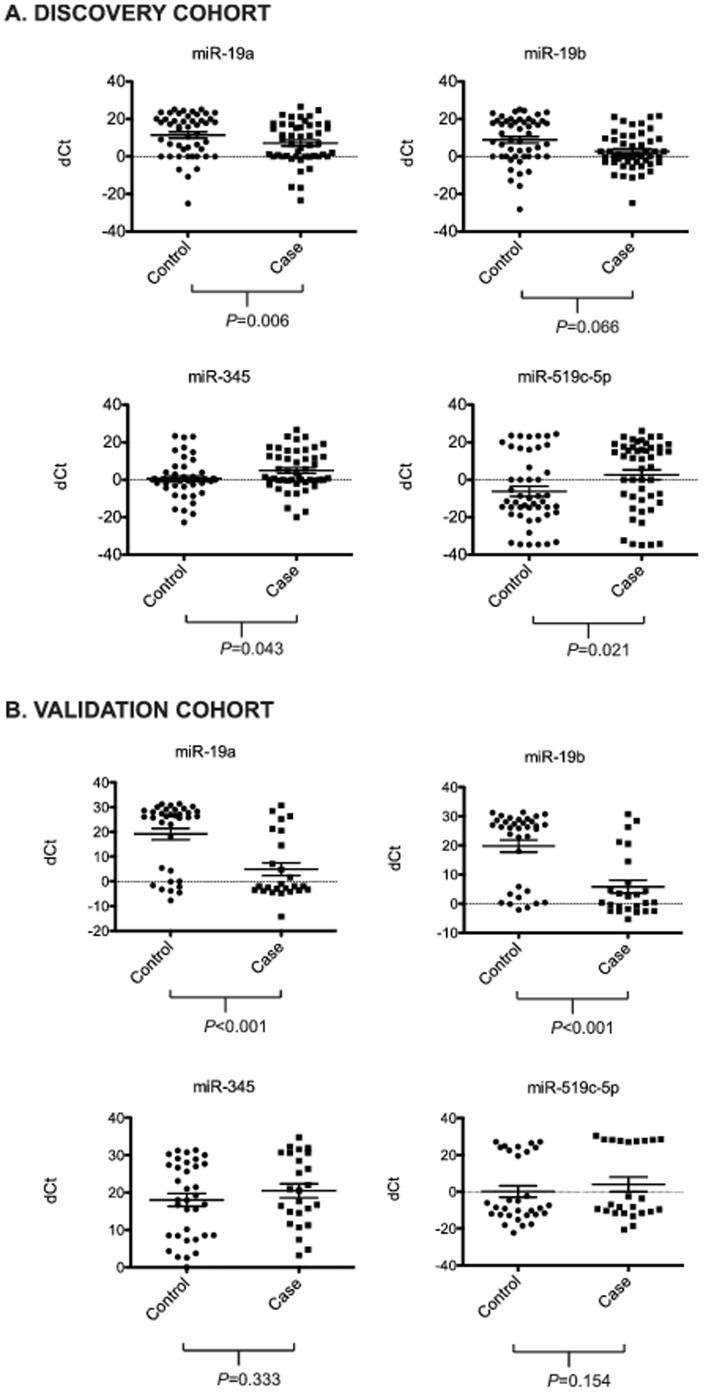
Figure 2. Distribution plots for serum miR-19b, miR-19a, miR-345, and miR-519c-5p delta Ct values in case versus control for a) discovery cohort, b) validation cohort.
Delta Ct represents difference between Ct of individual miRNA and median Ct value among detected miRNAs within each patient. Horizontal bars represent mean +/– SEM.

