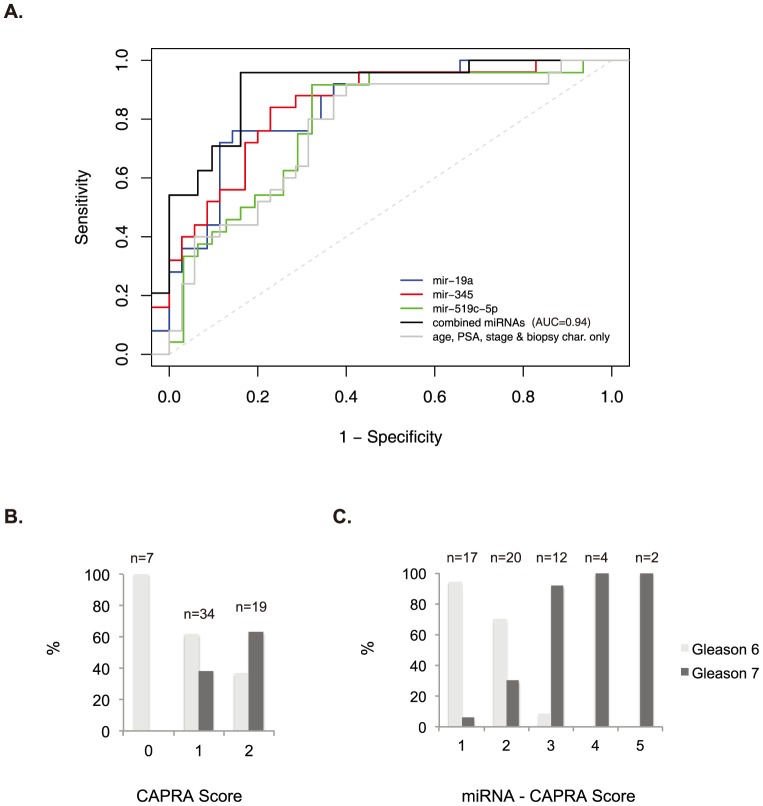
Figure 4. Prediction models for miRNAs.
A) ROC curves for age, PSA, and stage plus/minus individual miRNAs or combination of all 3 miRNAs. B) Percentage of patients with either Gleason 6 (light grey) or Gleason 7 (dark grey) post-surgery relative to pre-surgery CAPRA score. C) Same as B, but with addition of miRNAs. A value of 1 is given for each positive miRNA and added to CAPRA score. CAPRA nomogram combines the following variables: Age at diagnosis, PSA at diagnosis, Gleason score of pre-surgical biopsy, Clinical stage, and Percent of involved biopsies.

