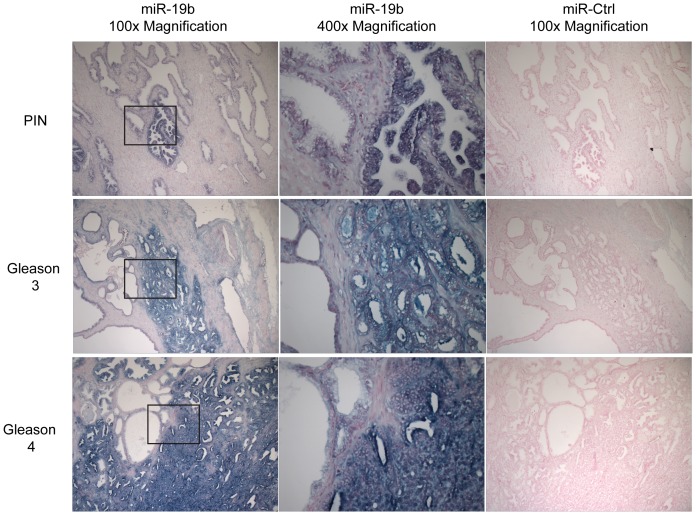
Figure 5. Staining for miR-19b in patient tumor samples.
Images show in situ hybridization staining for miR-19b (left and center panels) and negative control, miR-295 (right panels). Top panels show area of prostate intraepithelial neoplasia (PIN). Middle panels show area of Gleason 3. Bottom panels show area of Gleason 4. Areas of PIN, Gleason 3, and Gleason 4 all stain strongly for miR-19b probe (blue staining). Note each panel has area of normal-appearing epithelium, most clearly seen on the left of each center panel. These areas show much lower staining. Right and left panels, 100× magnification. Center panels, 400× magnification. Center panels represent boxed areas in left panels.

