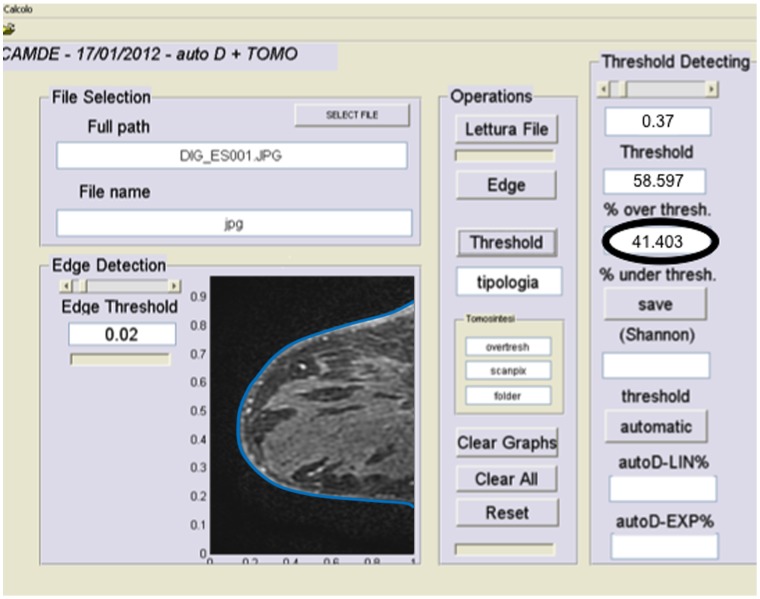
Figure 1. Quantitative assessment of breast density using the thresholding method.
In this figure an example of the graphical computer interface is demonstrated. On the left, the edges of the breast are identified (edges are artificially thickened for visual purposes), then the radiologist adjusts the density threshold (semi-automated method) on the right, and finally the percentage of breast density is shown (black circle). In this example, the breast result was 41% dense.

