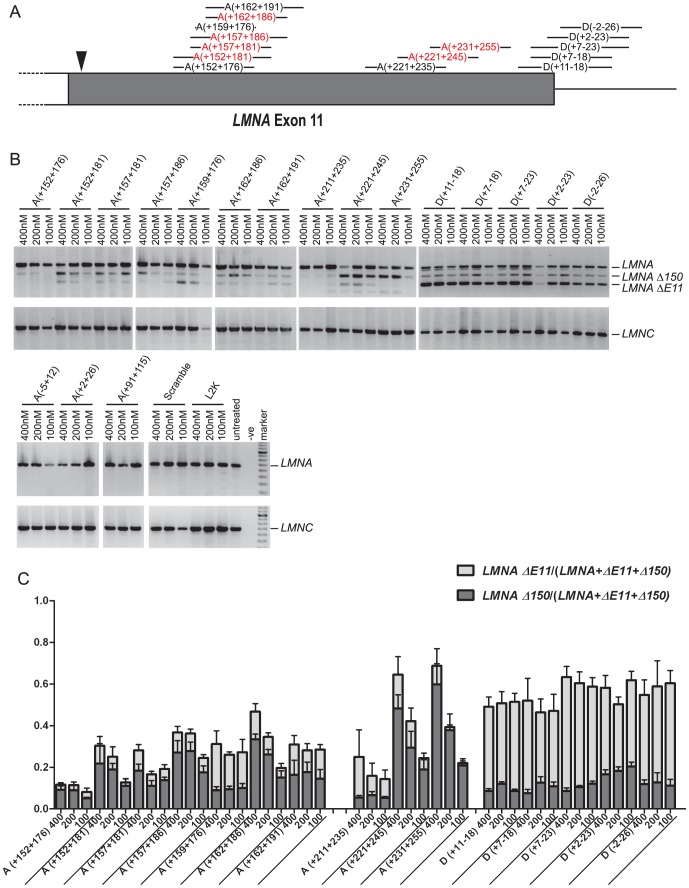
Figure 2. RT-PCR showing changes in LMNA splicing after transfecting with 2OMe AOs.
(A) AO annealing location within the 150 base region of exon 11excluded in HPGS (in grey). The arrowhead denotes the site of the classic HGPS C>T mutation. AOs that induce the greatest degree of cryptic splicing activation are shown in red. (B) Representative gel images of RT-PCR LMNA-related products from cells transfected over a range of concentrations. A smaller fourth LMNA transcript product induced in cells transfected with 11A(+211+235) to 11A(+231+255) was identified as missing exons 10+11. (C) Semi quantitative analysis by densitometry of gel band intensity, indicating levels of different LMNA transcripts. Bars denote mean ±SE.

