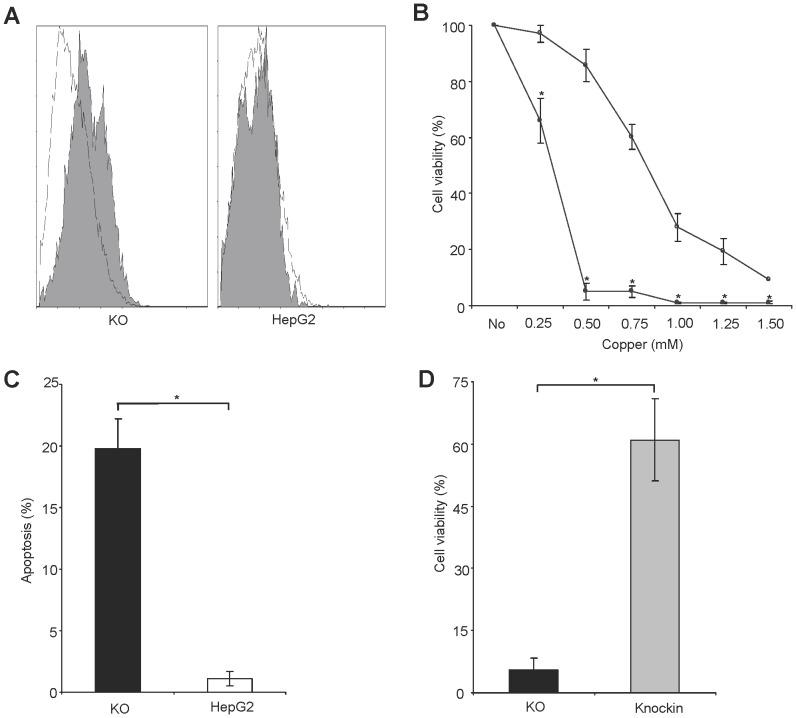
Figure 3. Oxidative stress and viability of KO cell line.
(A) Oxidative stress following Cu exposure at 0.1 mM Cu for 1 h. The four histograms represent fluorescence of viable cells as obtained by flow cytometry after staining with H2DCFDA dye. A shift of the two histograms appears in KO cells after Cu exposure (shaded) relative to untreated control (open) indicating induction of OS. (B) Viability of KO (circles) and HepG2 cells (triangle) relative to untreated control was determined by MTT assay after 48 h of Cu exposure. (C) Induction of apoptosis was determined after 24 h of 0.1 mM Cu exposure using Annexin-V staining followed by flow cytometry analysis. (D) Cell viability of knockin versus KO cell is shown. Viability was determined at 0.5 mM Cu by MTT assay after 48 h. Data is represented as mean±SE of three independent experiments. Asterisks indicate significance (p<0.05).

