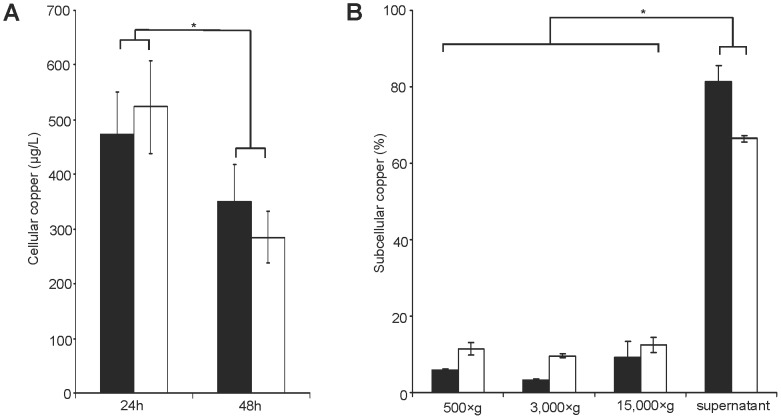
Figure 4. Cellular copper of KO cell line.
(A) Total cellular Cu was determined after 24 h or after chase (48 h). Cells were subjected to AAS analysis. Data are recorded for viable 106 cells. (B) Cu concentrations of cell lysates from KO (black) and HepG2 cells (open) are shown. Subcellular fractions were derived by differential centrifugation after 48 h Cu exposure. Data is represented as mean±SE of three independent experiments. Asterisks indicate significance (p<0.05).

