
Figure 6. Cellular copper in KO cells after drug treatment.
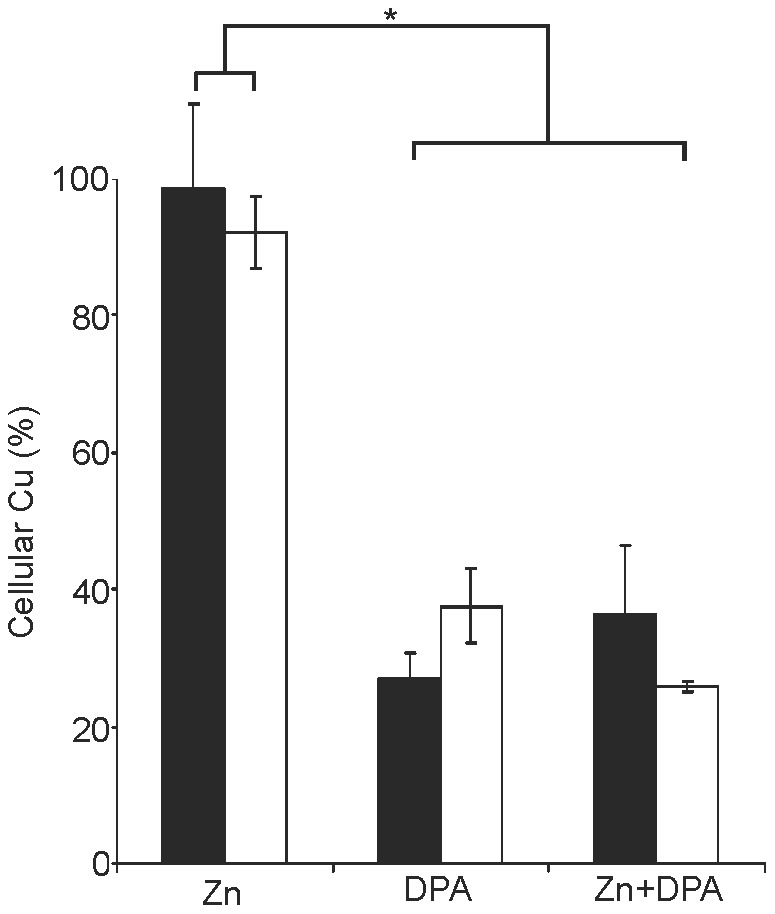
Cells were treated with drugs essentially as described for Figure 5. 0.1 mM Cu was used. Cells were subjected to Cu determination by AAS. Total cellular Cu of KO (black) and HepG2 cells (open) is given relative to the absolute number of the Cu concentration as shown in Figure 4A (100%). Data is represented as mean±SE of three independent experiments. Asterisks indicate significance (p<0.05).