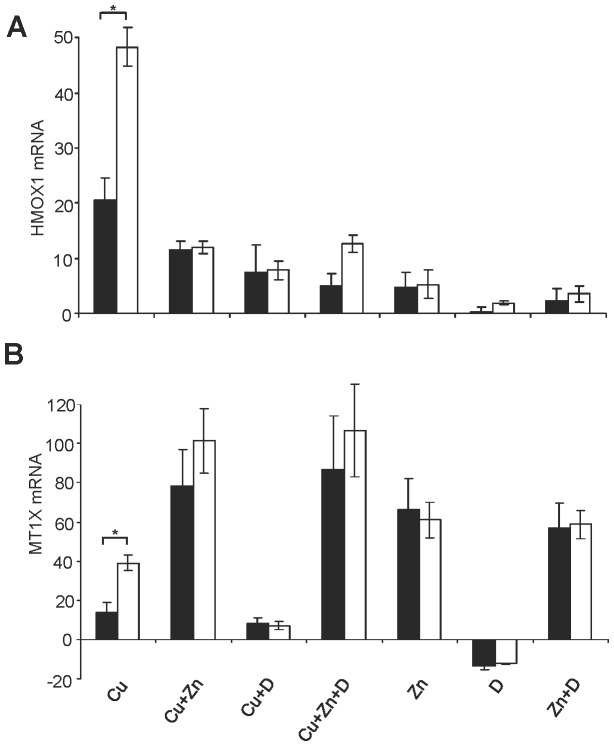
Figure 7. Gene expression of KO cells following drug treatment.
Cells were treated with drugs for 2(Zn pretreatment) and 6 h (DPA). Total RNA was isolated after 6 h of treatment and subjected to reverse transcription followed by real-time PCR analysis. Gene expression of KO (black) and HepG2 cells (open) expressed as factor fold change relative to untreated is shown for HMOX1 (A) and MT1X (B). Data is represented as mean±SE of three independent experiments. Asterisks indicate significance (p<0.05).

