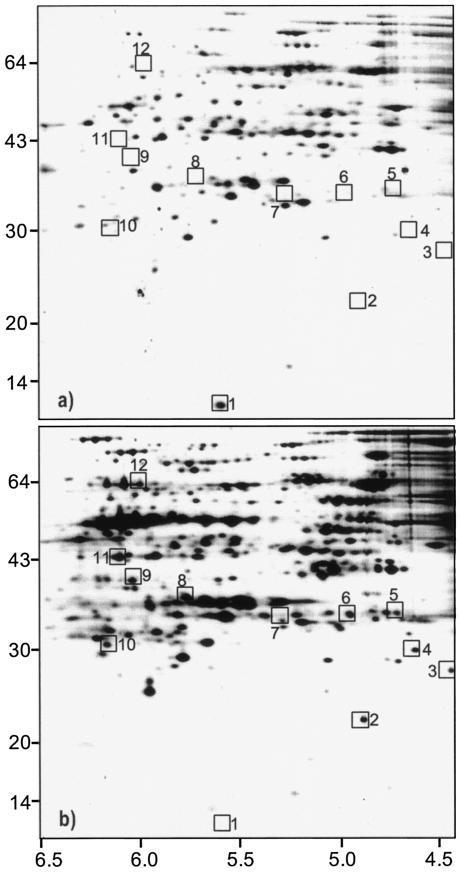
FIG. 3.
2D-E of membrane-associated proteins of O. oeni cells grown in the absence (a) and in the presence (b) of 8% ethanol. Proteins were extracted from the same amount of cells. The same samples were used to extract integral membrane proteins (see above and Materials and Methods). Molecular masses (in kilodaltons) of marker bands (left side) and pI ranges (bottom) are indicated. Selected proteins are boxed and numbered (see also Table 4).

