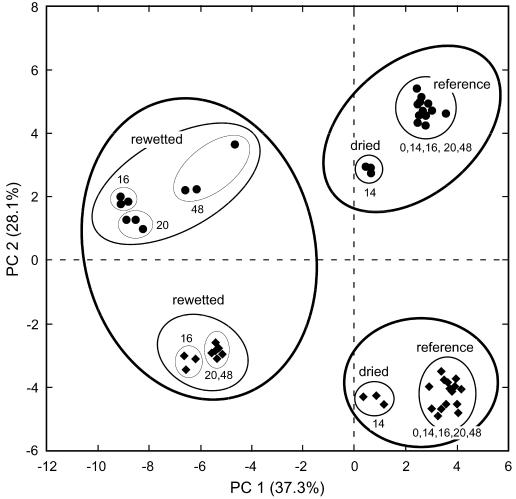
FIG. 5.
PCA of T-RFLP data obtained from 16S rRNA gene (•) and rRNA (♦) analyses of the domain Bacteria for the reference and test soils. Each data point represents a single analysis of an independent sample. The lines around data points indicate the groups that formed clusters in the hierarchical CA. The different types of lines indicate the different hierarchic clustering levels identified, as follows: thick lines, three main clusters at the highest branching level; medium lines, subclusters at the second branching level; thin lines, subclusters at the third branching level. The numbers next to the subclusters indicate the sampling days included. The values in parentheses indicate the percentages of variance accounted for by the first two principal components, PC 1 and PC 2.

