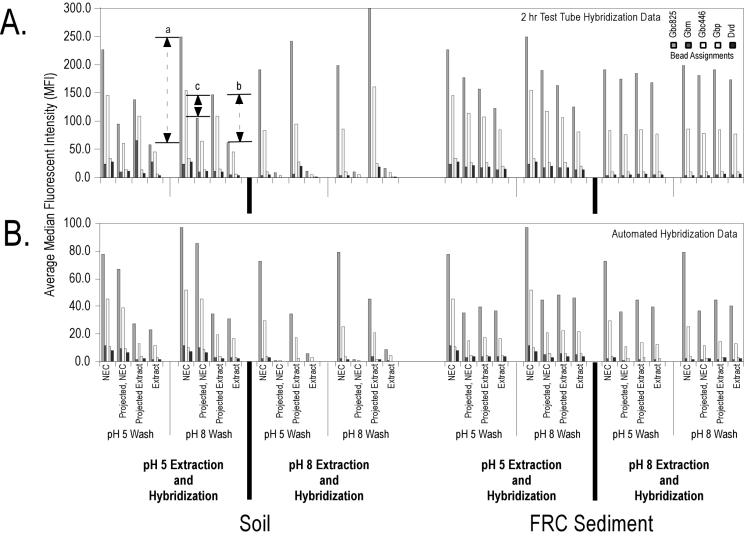
FIG. 5.
Integrated nucleic acid purification and flow cytometry detection in manual (A) and automated (B) formats with tunable surface extraction, hybridization, and wash conditions. A sample of 100 ng of fragmented G. chapellei target RNA and chaperone probes were added directly to each environmental extract and hybridized for 2 h in a test tube or processed through the automated routine, both at 45°C. All experimental signals are corrected for background bead fluorescence in the respective hybridization and wash conditions. Error bars are omitted for presentation clarity. NEC represents the no-extract control (experimental value); Projected, NEC represents the average MFI of the no-extract control (experimental value) times the percent reduction in signal intensity, i.e., the signal intensity one would expect if the sediment extract alone were added to the beads (i.e., the value in Table 3 for the particular buffer and wash conditions); Extract represents the amended extract (experimental value); and Projected Extract represents the average MFI of the amended extract times (1/percent reduction in signal intensity), i.e., the hybridization signal expected assuming no quenching of or interference with the reading of the Alexa-532 reporter. Interval a is the difference between the average MFIs of the amended extract and the purified RNA hybridization control and represents the decrease in hybridization signal due to the combined effects of fluorescence quenching and hybridization interference. Interval b is the difference between the average MFIs of the amended extract and the projected extract and represents an estimate of the effect of the environmental background on hybridization efficiency alone. Interval c is the difference between the average MFIs of the projected no-extract control and the projected extract and represents an estimate of the uncertainty associated with the effect of the environmental background on Alexa-532 reporting efficiency. The order of the bead assignments (from left to right) in the key is the same as in the bar graphs.

