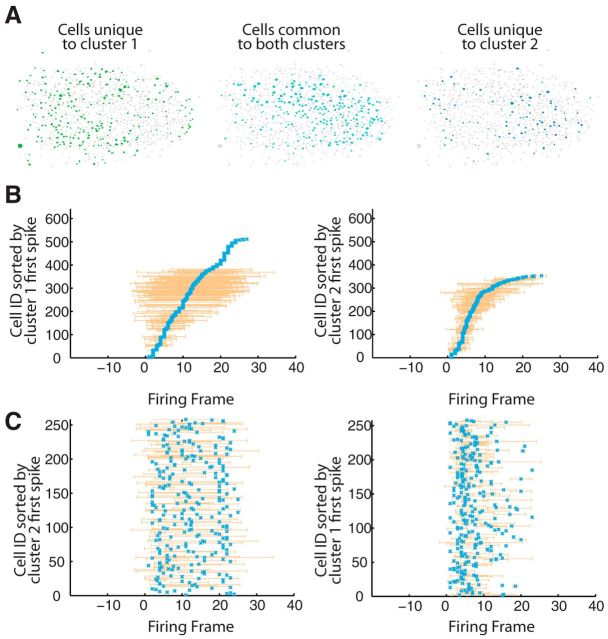
Figure 4.
Spatial clusters exhibit different firing trajectories. A, Anatomical spatial representation of clusters. Left, Union of all cells in cluster 1 that are unique to cluster 1 indicated as green-filled cellular contours. Right, Union of all cells in cluster 2 that are unique to cluster 2 indicated as blue-filled cellular contours. Middle, Intersection of cells in cluster 1 and cluster 2 indicated as dark blue-filled cellular contours. B, Same cluster sorting of spike times. Left, Firing of circuit events in cluster 1 (n = 4 events, 511 cells) sorted by mean cluster 1 firing times. Right, Firing of circuit events in cluster 2 (n = 2 events, 353 cells) sorted by mean cluster 2 firing times. Frame duration = 89 ms. C, Alternate cluster spike time sorting. Firing of circuit events in cluster 1 sorted by mean cluster 2 firing times for shared neurons (n = 258). Right, Firing of circuit events in cluster 2 sorted by mean cluster 1 firing times for shared neurons (n = 258).

