
Figure 1.
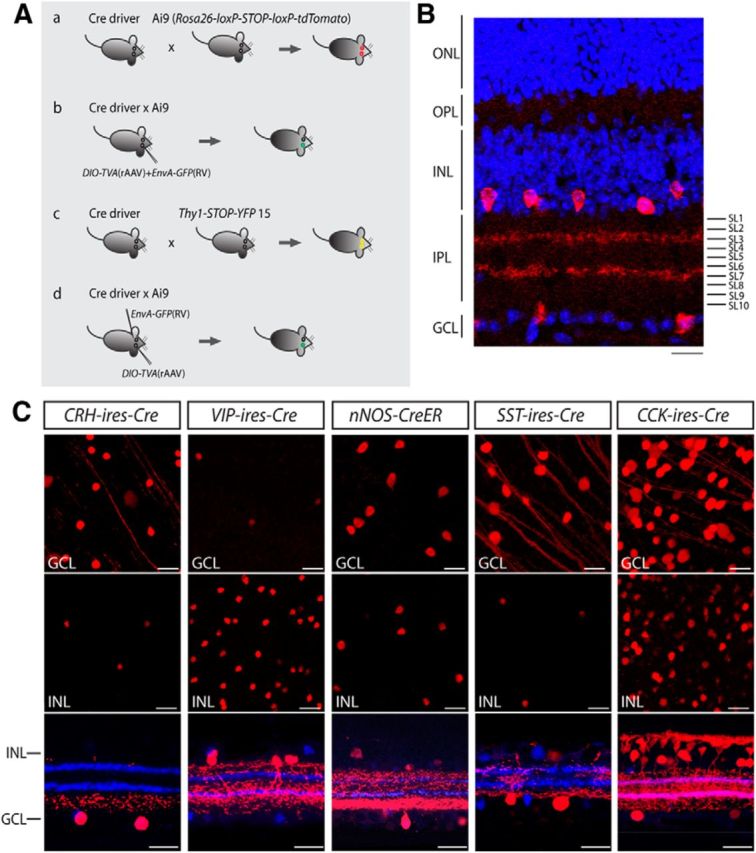
Mouse lines with Cre predominantly expressed in inner retinal neurons. A, Screening strategies for cell type-specific expression of Cre in the inner retina. The distribution of Cre-expressing cells was examined by crossing each Cre driver with Ai9 reporter mice (a), followed by cell type-specific labeling of amacrine cells with intravitreal injection of a rAAV that codes for a floxed TVA and an EnvA-pseudotyped rabies virus carrying GFP (b). Cre expression in ganglion cells was evaluated by crossing each line with Thy1-STOP-YFP 15 mice (c). To individually label ganglion cells, a rAAV encoding for a floxed TVA was introduced into the eye of the Cre × Ai9 mice, and EnvA-pseudotyped rabies virus carrying GFP was subsequently applied to ganglion cell axonal terminals in a retino-recipient area such as the LGN or SC (d). B, Organization of the retina and definition of IPL stratification. A vertical section of mouse retina labeled with the nuclear stain TO-PRO-3 (blue) and antibodies to ChAT (red). The level of stratification was defined as 0–100% from the border of the INL to the border of the GCL. The positions of ON and OFF-ChAT bands were estimated at 60% and 27% of the IPL, respectively. The IPL can be further divided into 10 equal strata or sublaminae (SL1–SL10) in which the ChAT bands occupy SL3 and SL7. ONL, Outer nuclear layer; OPL, outer plexiform layer. Scale bar, 25 μm. C, Distribution of Cre-expressing cells in the CRH-ires-Cre, VIP-ires-Cre, nNOS-CreER, SST-ires-Cre, and CCK-ires-Cre retinas. Each driver was crossed with Ai9 mice (Rosa26-lox-stop-lox-tdTomato) as shown in Aa). TdTomato-labeled cells are shown in the GCL (top), the INL (middle), and vertical sections with ChAT (blue; bottom). Scale bar 25 μm.