
Figure 10.
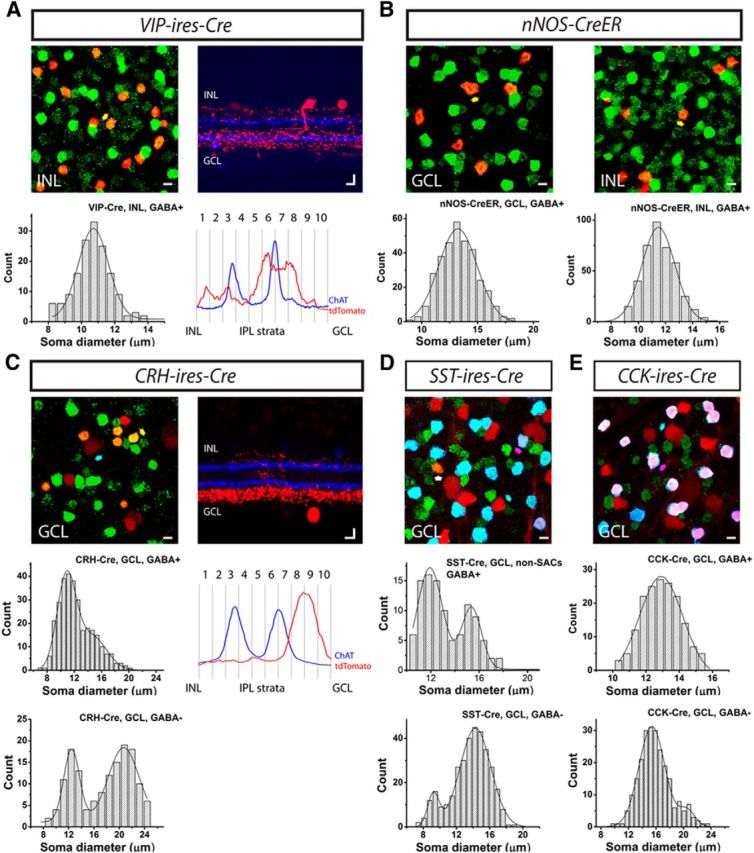
Evaluation of the completeness of labeling in Cre driver lines based on soma diameter and level of dendritic stratification. A–E, Five Cre driver lines, including VIP-ires-Cre (A), nNOS-ires-CreER (B), CRH-ires-Cre (C), SST-ires-Cre (D), and CCK-ires-Cre (E), were crossed with Ai9 reporter mice (tdTomato; red), and the retinas were further stained with an antibody against GABA (green). A, B, All tdTomato-labeled cells were GABAergic (GABA+; yellow arrow shows an example of somatic colocalization). C–E, In addition to GABAergic cells (yellow arrow), non-GABAergic cells (GABA−; cyan arrow) were also observed, with somata labeled with tdTomato, but not GABA. D, E, GABAergic cells were further separated with an antibody against ChAT (blue). Cells labeled with tdTomato, GABA, and ChAT were SACs (pink arrow), whereas cells labeled with tdTomato and GABA but not ChAT were non-SAC GABAergic cells (white arrow). Evidently, all of the GABAergic cells in the CCK-ires-Cre retina were SACs. The soma diameters of GABAergic cells (A–C) in the INL (A), GCL and INL (B), and GCL (C), and non-GABAergic cells (C–E), SACs (E), and non-SAC GABAergic cells (D) in the GCL were measured and plotted as distribution histograms. The histograms were fitted with either single or double Gaussian curves (see Table 3 for fit parameters). The non-GABAergic cells (presumptive RGCs) in the SST-ires-Cre line (D) were omitted from our classification due to the high abundance of labeled cell types, but their soma sizes were analyzed here for completeness. The IPL strata in the VIP-ires-Cre and CRH-ires-Cre were further analyzed in A and C. Vertical slices of the retinas were stained with an antibody against ChAT (blue), and 10 strata in the IPL were defined using the ChAT bands. Stratification of tdTomato-labeled arbors was quantified relative to the ChAT. Scale bar, 10 μm.