Figure 7.
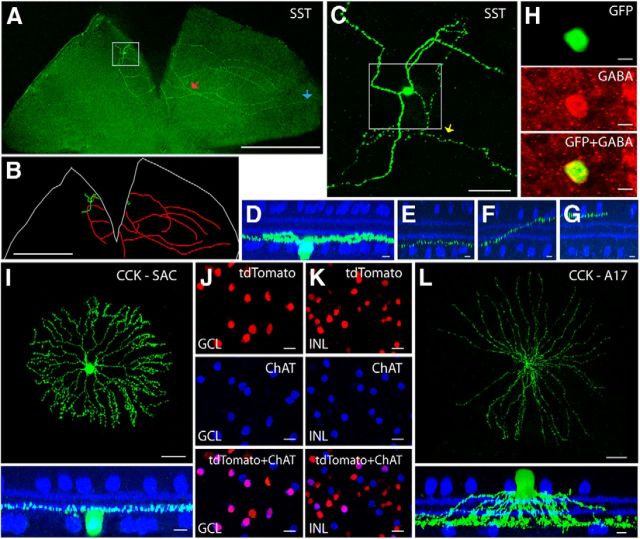
Labeling in the SST-ires-Cre and CCK-ires-Cre driver lines. A, A flat-mounted retina with a single-labeled SST-1 amacrine cell. Scale bar, 1 mm. B, Neurolucida tracing of A, with the dendrites and soma drawn in green, the axon-like processes drawn in red, and the outline of the retina marked in white. Scale bar, 1 mm. C, Enlarged view of the boxed region in A. Scale bar, 50 μm. D, The side views with ChAT (blue) of the boxed region in C, including the soma, dendrites, and axon-like processes. Scale bars, 10 μm. E–G, An axon-like process starts near the GCL (E, marked with the yellow arrow in C), extends across the IPL (F, red arrow in A), and finally runs near the INL (G, blue arrow in A). Scale bars, 10 μm. H, The SST-1 amacrine cell is GABAergic. Scale bar, 10 μm. I, The displaced amacrine cells in the CCK-ires-Cre driver are SACs. A GFP-labeled SAC is shown in the flat-mount view (top; scale bar, 50 μm), and the side view with ChAT (bottom; scale bar, 10 μm). J, K, Cre-positive SACs in the GCL (J) and INL (K). A retina from a CCK-ires-Cre × Ai9 mouse was stained with antibody against ChAT. Note that only a fraction of the SACs (labeled with ChAT) express Cre in the CCK-ires-Cre driver line. Scale bars, 20 μm. L, A17 amacrine cells were targeted in the CCK-ires-Cre driver line. An A17 cell was labeled with GFP. The flat-mount view is shown in the top (scale bar, 100 μm) and the side view with ChAT labeling is shown in the bottom (scale bar, 10 μm).

