Figure 8.
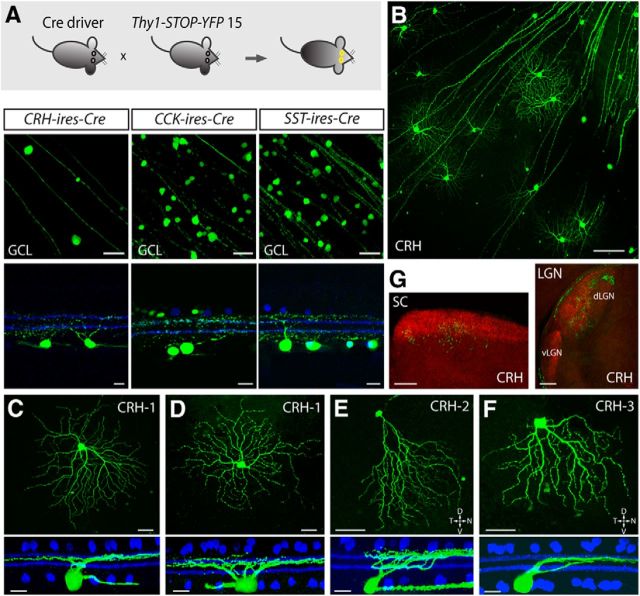
Cre-expressing RGCs in the CRH-ires-Cre driver line. A, Strategy for isolating Cre-expressing RGCs. Each Cre driver line was crossed with a Thy1-STOP-YFP 15 line (top). EYFP-labeled RGCs were observed in the CRH-ires-Cre, CCK-ires-Cre, and SST-ires-Cre lines, with flat-mount views shown in the middle (scale bar, 50 μm), and side views with ChAT (blue) shown in the bottom (scale bar, 10 μm). B, A flat-mount retina from a CRH-ires-Cre × Thy1-STOP-YFP 15 mouse. Scale bar, 100 μm. C–F, Morphology of different types of CRH-RGCs. Flat-mount views are shown in the top (scale bar, 50 μm), and side views with ChAT (blue) are shown in the bottom (scale bar, 20 μm). G, Coronal view of CRH-RGC axonal projections within the retino-recipient zone of the SC (left) and the dLGN (right). All the RGC axons from both eyes were labeled with CTb-594 (red); CRH-RGC axons were labeled with GFP (green). Scale bar, 200 μm.

