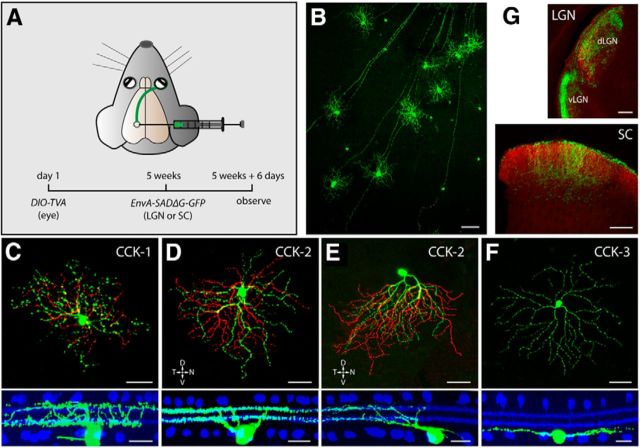
Figure 9.
Cre-expressing RGCs in the CCK-ires-Cre driver line. A, Strategy using rAAV/EnvA rabies virus to label CCK-RGCs from axonal terminals. B, GFP-labeled CCK-RGCs in a flat-mount retina from a CCK-ires-Cre mouse. Scale bar, 100 μm. C–F, Morphology of different types of CCK-RGCs. Flat-mount view of each type of RGC (green) are shown in the top, with soma and ON arbors labeled in green and OFF arbors pseudocolored in red. Scale bar, 50 μm. Side views with ChAT-band (blue) are shown in the bottom. Scale bars, 20 μm. G, Coronal view of CCK-RGC axonal terminals in the SC, the dLGN, and the vLGN. All RGC axons from both eyes are labeled with CTb-594 (red); CCK-RGC axons are labeled with GFP (green). Scale bar, 200 μm.

